Model Chain of the Water Sector
The variables of the water sector (water balance, evapotranspiration, runoff, groundwater recharge, discharge) are results of the hydrological model SWIM. SWIM was driven directly with the climate data of global climate models; no regional climate model lies in between. The chain has four steps:
- Global climate models (CMIP6). Ten global climate models (CanESM5, CNRM-CM6-1, CNRM-ESM2-1, EC-Earth3, GFDL-ESM4, IPSL-CM6A-LR, MIROC6, MPI-ESM1-2-HR, MRI-ESM2-0, UKESM1-0-LL) provide daily data for the historical period and the scenarios SSP1-2.6, SSP3-7.0 and SSP5-8.5.
- Bias adjustment and statistical downscaling (ISIMIP3b). Temperature (mean, minimum, maximum), precipitation, global radiation and relative humidity of these models were bias-adjusted against the observation-based dataset W5E5 v2.0 and statistically downscaled to a grid of 0.5° (about 55 km) with the method ISIMIP3BASD v2.5.0.
- Hydrological model (SWIM). With these daily data, SWIM computed the water balance for 28 large European river basins, divided into subbasins and hydrotopes. Each subbasin receives the climate data of the 0.5° grid. This gives one run per climate model and scenario.
- Preparation for the portal. The results of the subbasins were transferred to a regular grid and summarised per time period across the climate models (median and range), as in the other sectors.
Notes on interpretation
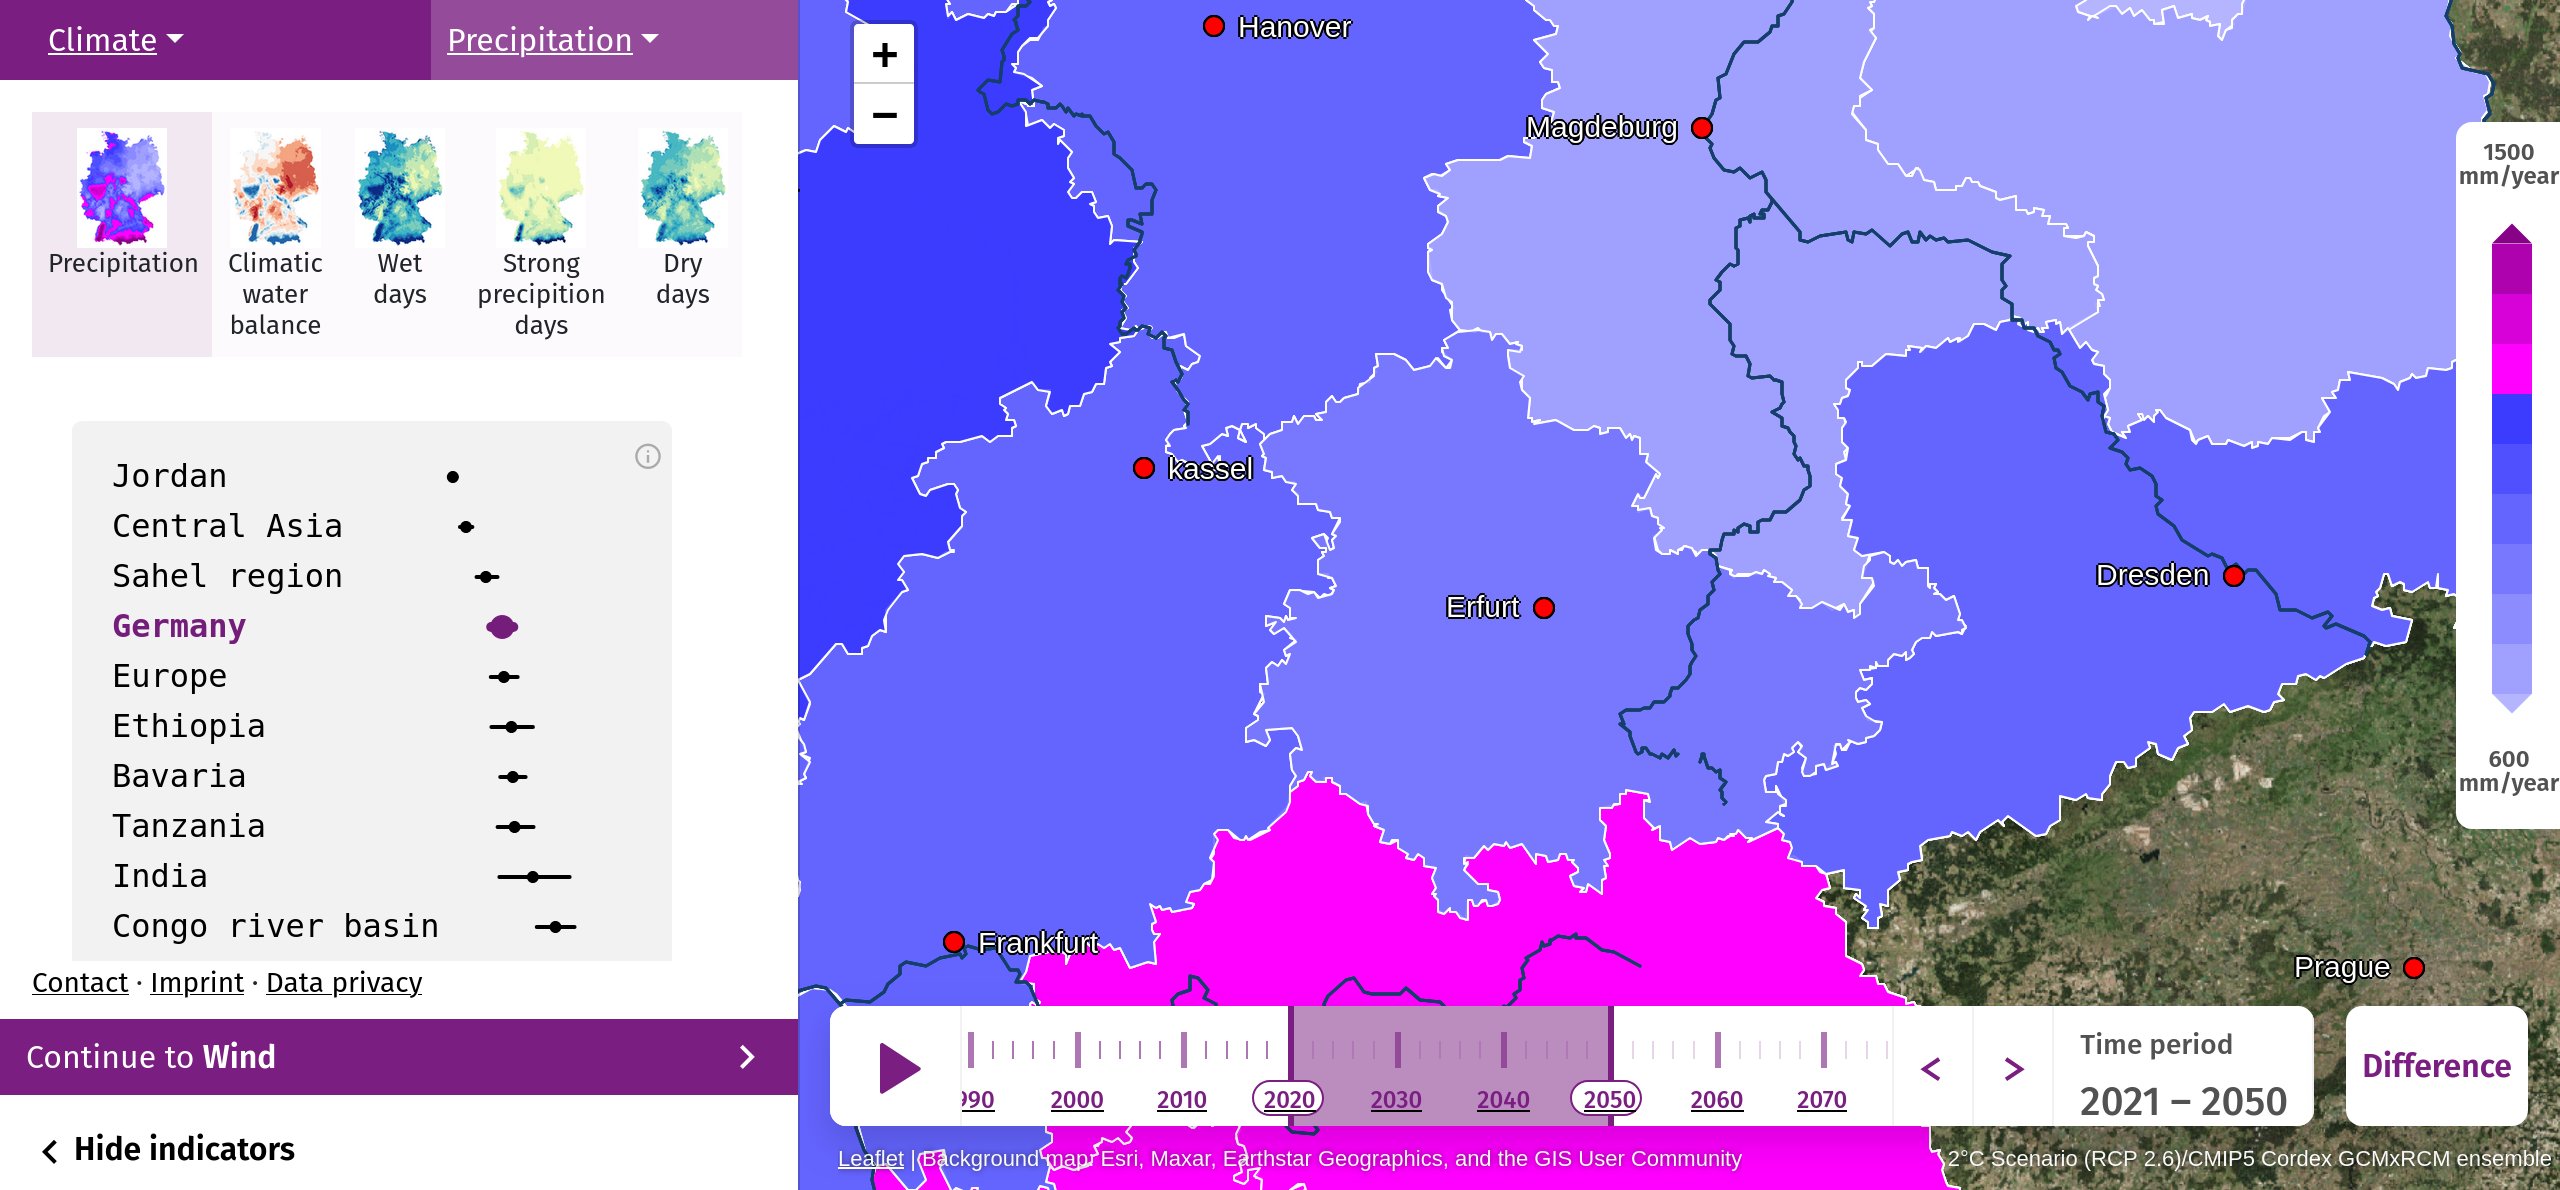
- The map shows the subbasins of SWIM; within a subbasin the values are uniform. The spatial detail of the climate forcing is 0.5°.
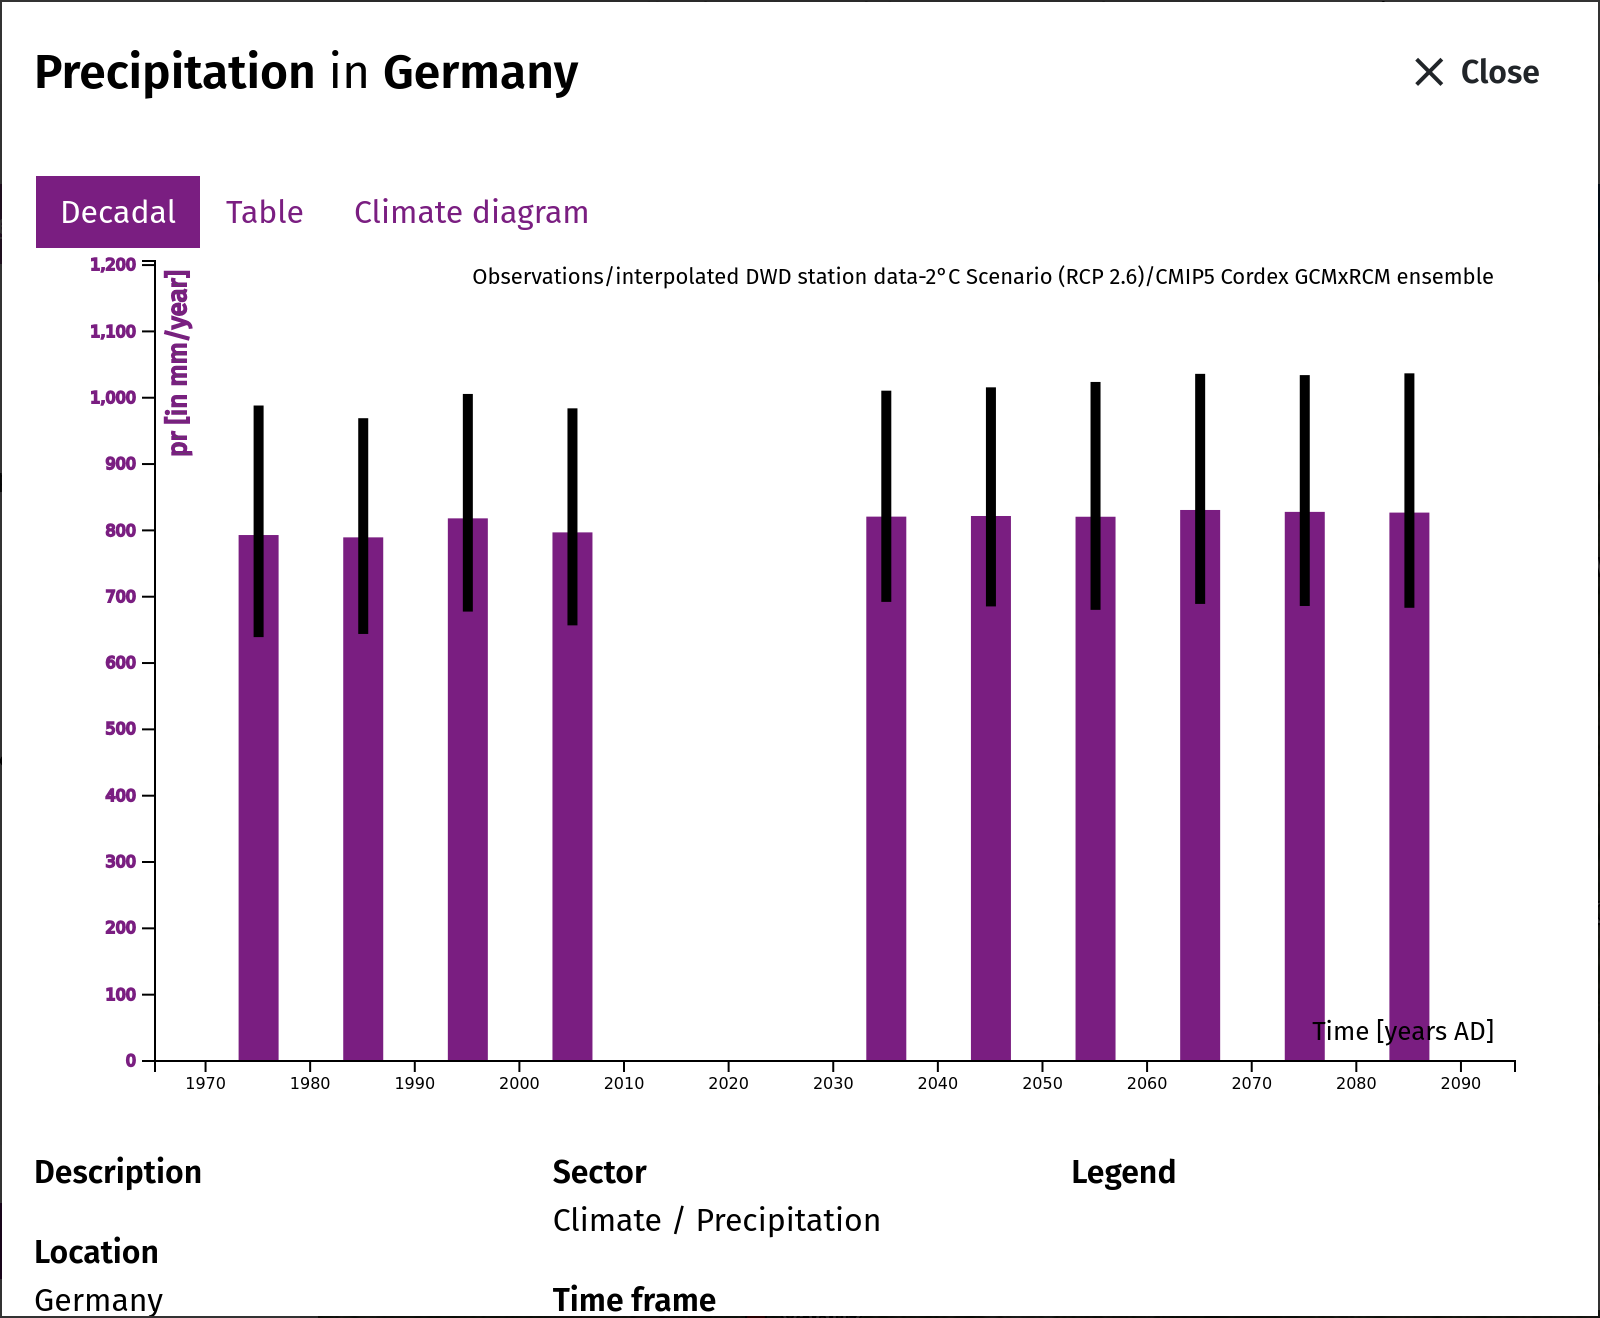
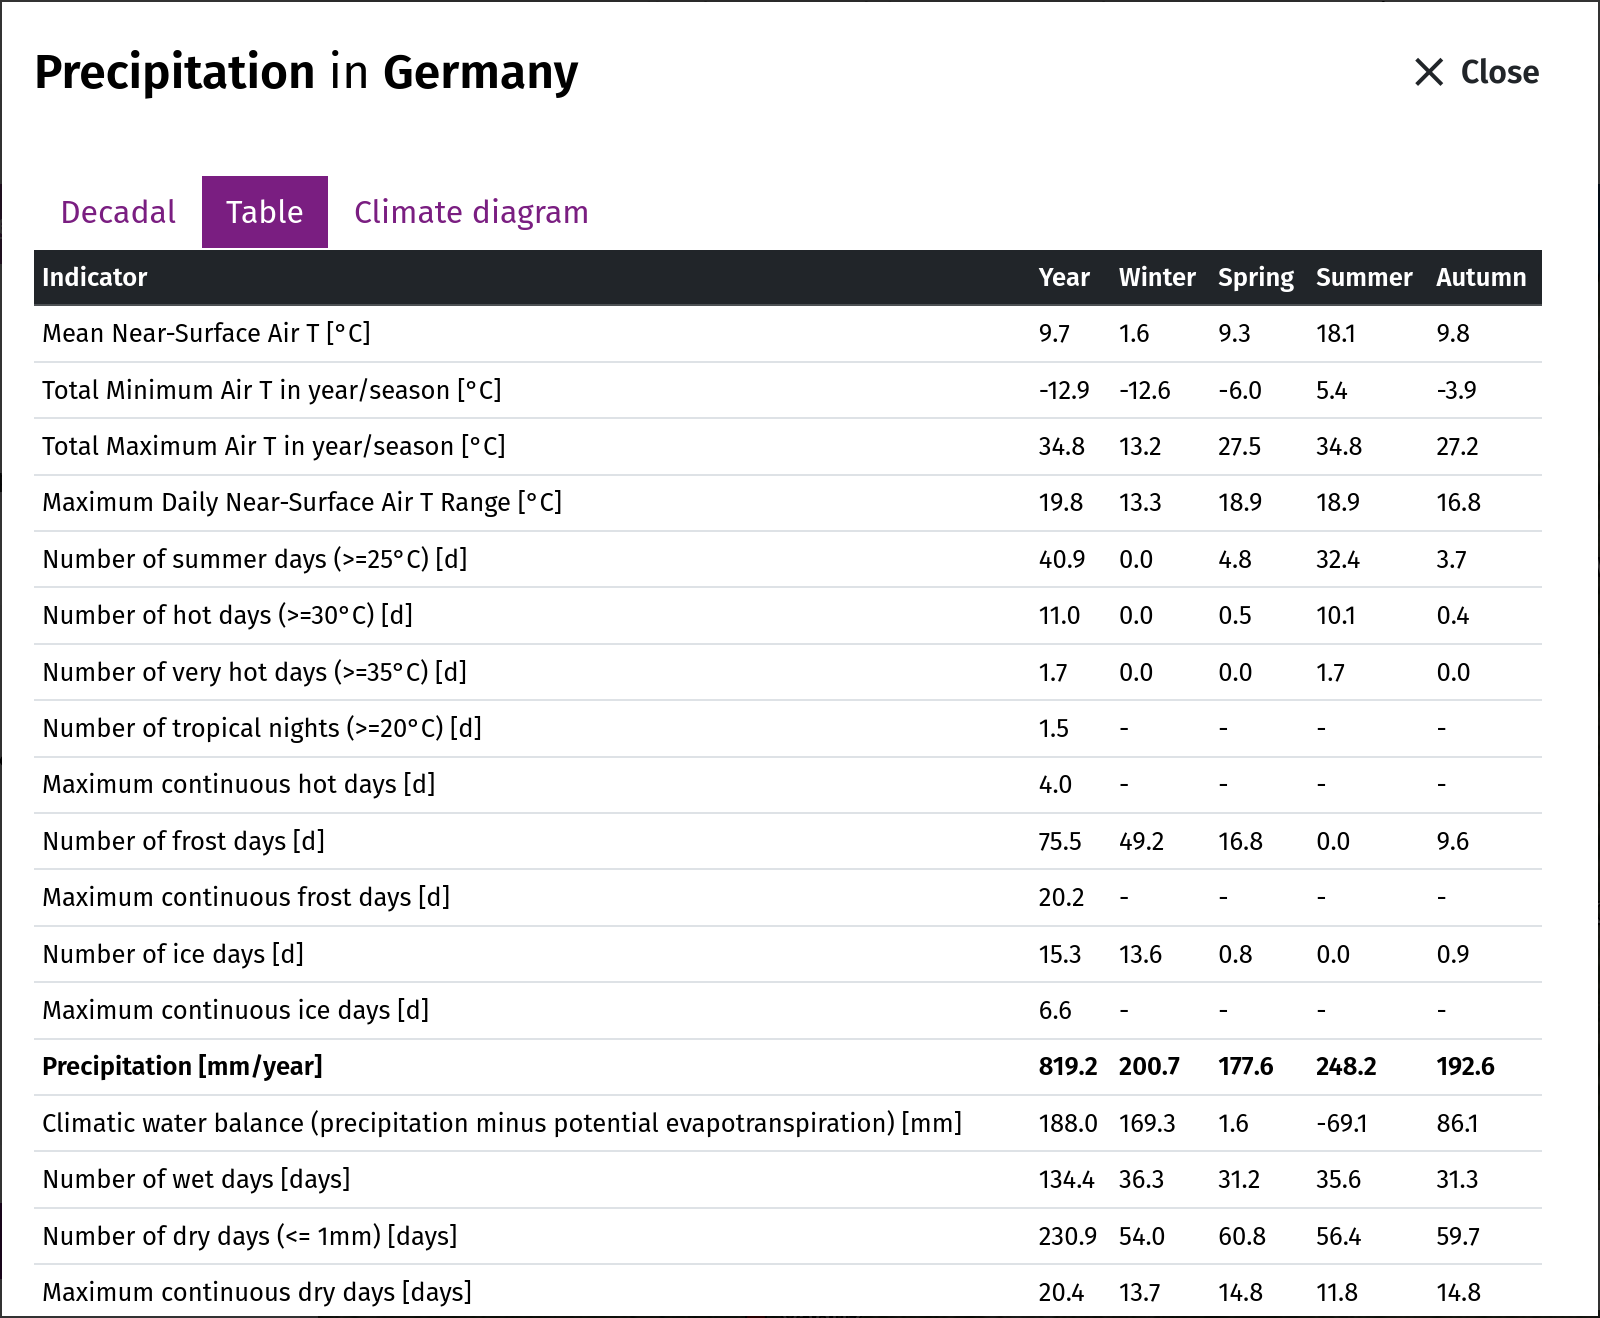
- The precipitation of the water sector is the ISIMIP3b precipitation used by SWIM. Its level follows the reference W5E5 and can therefore differ from the precipitation of the climate sector, which is based on other data in some regions (in Germany on regional climate models and DWD observations).
- The historical period of the water sector is a model simulation with the same climate models; there are no observation-based water data in the portal.
Sources
Lange, S., 2019. Trend-preserving bias adjustment and statistical downscaling with ISIMIP3BASD (v1.0). Geoscientific Model Development, 12, 3055-3070. https://doi.org/10.5194/gmd-12-3055-2019
Lange, S., 2021. ISIMIP3BASD (v2.5.0). Zenodo. https://doi.org/10.5281/zenodo.4686991
Lange, S. et al., 2021. WFDE5 over land merged with ERA5 over the ocean (W5E5 v2.0). ISIMIP Repository. https://doi.org/10.48364/ISIMIP.342217
ISIMIP3b protocol: https://www.isimip.org/protocol/3/
SWIM Model
A separate model was used for generating the water sector variables data in this region: the Soil and Water Integrated Model (SWIM).
What does the model do?
SWIM was specifically developed to investigate climate and land use change impacts at the regional scale, where the impacts are manifested and adaptation measures take place. The model simulates interlinked processes at the mesoscale such as runoff generation, plant and crop growth, nutrient and carbon cycling, and erosion. It provides numerous model outputs such as river discharge, crop yield, and nutrient concentrations and loads. The approach allows simulation of all interrelated processes within a single model framework at a daily time step using regionally available data (climate, land use and soil) and considering feedbacks. The model setup and postprocessing are supported by a GIS interface (based on GRASS). The model uses 3-level disaggregation scheme: basin – subbasins – hydrotopes. The results are presented as time series and maps for a number of variables. SWIM is a model of intermediate complexity for the river basin and regional scale, because it is a) more comprehensive than purely hydrological and precipitation-runoff models due to a more reliable representation of interlinked hydrological, vegetation and nutrient processes; b) driven by commonly available regional data and can be easier parametrized than more complex hydrological models.
Who maintains it?
SWIM is maintained and further developed by the regional hydrological modelling group of Research Department 2 on PIK's own GitLab source code repository. The development is coordinated by Michel Wortmann, Stefan Liersch and Fred Hattermann.
In what way is the model different from other models in the community?
Simulation of hydrological cycle (water discharge, groundwater level): the same or better than in other comparable ecohydrological and hydrological models;Simulation of hydrological cycle at the river basin scale: better and more detailed process description than in the continental-scale terrestrial models, and in large-scale water resources models;
Simulation of vegetation processes: better than in many hydrological models, which normally do not consider dynamical vegetation processes;
Simulation of water quality: better than in conceptual hydrological models which have no (or only minor) representation of soil processes;
Simulation of diffuse pollution: better than in other commonly used models because of a better temporal and spatial resolution and consideration of dynamical landscape processes;
Simulation of land use, agriculture management, crop yields and feedbacks of climate and land use changes: better than in other models with reduced representation of vegetation growth processes.
Sources:
Krysanova, V., F. Hattermann, Sh. Huang, C. Hesse, T. Vetter, S. Liersch, H. Koch and Z. W. Kundzewicz, 2014. Modelling climate and land use change impacts with SWIM: lessons learnt from multiple applications. Hydrological Sciences Journal, accepted.Krysanova, F. Wechsung, J. Arnold, R. Srinivasan, J. Williams, 2000. PIK Report Nr. 69 "SWIM (Soil and Water Integrated Model), User Manual", 239p. SWIM_Manual
Krysanova, V., Mueller-Wohlfeil, D.I., Becker, A., 1998. Development and test of a spatially distributed hydrological / water quality model for mesoscale water-sheds. Ecological Modelling, 106, 261-289.
Climate Scenarios
The so-called Representative Concentration Paths (RCPs) were developed for the fifth Assessment Report of the Intergovernmental Panel on Climate Change (IPCC). They describe different levels of greenhouse gases-induced radiation drives that might occur in the period 2011 till 2100. However, they did not include any socioeconomic “narratives” to go alongside them. Over the past few years, an international team of climate scientists, economists and energy system modelers developed a range of new “pathways” that examine how global society, demographics and economics might change over the next century. They are known as the “Shared Socioeconomic Pathways” (SSPs). The SSPs were published in 2017 (Riahi et al., 2017) and they will play a major role in the IPCC Sixth Assessment Report in 2021/2022.
SSPs are baseline scenarios that describe future developments in the absence of new climate policies, beyond those already in place today. They offer five pathways that the world could take. The five SSPs differ mainly in population growth, urbanization, economic growth, investments in education and health, energy system and land use, rate of technological development as well as drivers of demand, such as lifestyle changes (Riahi et al., 2017).
As the RCPs the SSPs are also not complete in their design, as these are only social futures with do not include climate change impacts. Moreover, no mitigation or adaption measures are implemented in these (O'Neill et al., 2020). Therefore, ClimateImpactsOnline uses three SSP–RCP combination to visualize climate data corresponding to different socioeconomic and radiation scenarios.
“Sustainability” SSP1 - 2.6
The low climate change scenario (SSP1) presents a relatively sustainable path, often referred to as “Taking the Green Road”. The scenario assumes high investments in education and health. These lead to an acceleration of the demographic transition and to a slower population growth, especially in the developing countries. In total there is a broader emphasis on human well-being. Driven by an increasing commitment to achieving development goals, inequality is reduced both across and within countries. Consumption is oriented toward low material growth and lower resource and energy intensity. The SSP1 baseline scenario has low challenges to climate mitigation and adaption, as climate targets can be reached globally (O’Neill et al., 2017). The SSP1 is combined with an forcing output of 2.6 Watt per square meter in 2100.“Regional Rivalry” SSP3 - 7.0
The moderate climate change scenario (SSP3) also refered to as “Regional Rivalry” is characterized by resurgent nationalism and regional conflicts. This pushes countries to increasingly focus on domestic or, at most, regional issues. For example energy and food security goals are achieved only in their own region. Investments in education and technological development decline. Economic development is slow, consumption is material-intensive, and inequalities get worse over time. Furthermore, population growth is low in industrialized and high in developing countries. Overall SSP3 is characterized by a low international priority for addressing environmental concerns (Fujimori et al., 2017). The SSP3 scenario is combined with a forcing level of 7 Watt per square meter.“Fossil-fueled Development” SSP5 - 8.5
The extreme scenario (SSP5) is characterized by rapid technological progress and development of human capital. Global markets are increasingly integrated. There are also strong investments in health, education, and institutions to enhance human and social capital. At the same time, this is coupled with the exploitation of abundant fossil fuel resources and the adoption of resource and energy intensive lifestyles all around the world. There is faith in the ability to manage social and ecological systems, including by geo-engineering if necessary (Kriegler et al., 2017). ClimateImpactsOnline uses the combination of the SSP5 scenario with an level of greenhhouse gases-induced radiation of 8.5 Watt per square meter.See also:
The Shared Socio-Economic Pathways (SSPs): An Overview (Poster)
Sources:
O’Neill, B.C., Carter, T.R., Ebi, K. et al. Achievements and needs for the climate change scenario framework. Nat. Clim. Chang. 10, 1074–1084 (2020). https://doi.org/10.1038/s41558-020-00952-0
Riahi, K. et al., The Shared Socioeconomic Pathways and their energy, land use, and greenhouse gas emissions implications: An overview, Global Environmental Change, Volume 42, 153-168 (2017). https://doi.org/10.1016/j.gloenvcha.2016.05.009.